
Fast software is satisfying to use, less costly to operate, and responds better to scale. Yet trying to improve the performance of software often feels like herding cats. Identifying a performance issue and evaluating whether you made it better it is hard. It can be harder still to determine when you’ve improved it enough. How then can you approach software optimization with confidence?
We recently completed a performance improvement project of our own (check it out here). We identified a few guiding principles that helped us approach our optimization both systematically and iteratively. We were able to meet our goals with this approach, and we hope you find these helpful in your own performance pursuits!
Have an Optimization Goal
A successful optimization project starts with a performance goal. This should begin with a specific use case and capture how you intend to improve its performance. This prepares you for success in two ways. First, it identifies the performance metric you need to measure (response time, throughput, etc.). Second, it identifies the inputs and environment conditions that matter. These two pieces of information will help you develop an effective measurement plan.
Your performance goal should also establish your stopping point. Performance optimization tends to suffer from diminishing returns. Knowing when you have achieved enough performance for your use case is key to success.
Our goal was to lower the total response time for the initial loading of large policy documents (over 10,000 policy entries). We observed cases where the initial load response time for large policies was 4-5 minutes. Our target was to load these policies in under 1 minute with a typical server specification.
Measure Vigorously
The second guideline we followed was to measure early and measure often. You can’t know if you’ve improved if you don’t know where you started. You also can’t know if you’ve improved if you can’t observe the change in performance over time.
To do measurement well, you need a plan. A good measurement plan should be:
-
Repeatable
You need to record measurements often as you test assumptions and verify improvements. You want these measurements to be consistent and simple to collect. This will help you make better comparisons between before and after results. A small up-front investing in tools to help with this will make it much easier to test with confidence.
In our case, this was as simple as a script to automate and measure policy loading for all the key inputs from our test suite. This allowed us to observe the total effect of our changes and compare them over time.
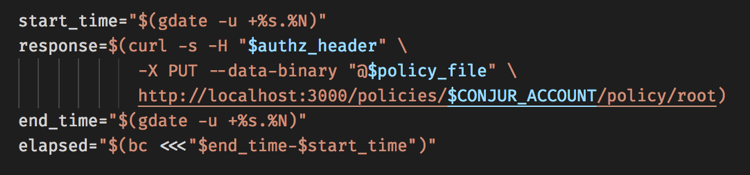
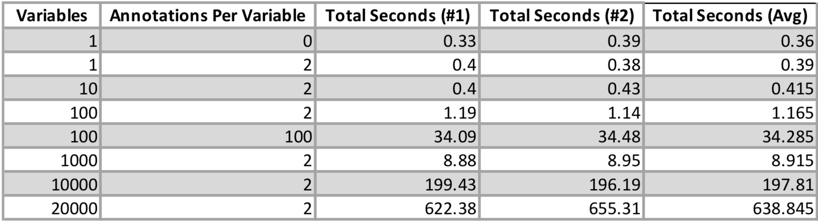
Figure 1) Measuring the total response time to load a policy
-
Granular
Your key performance metric sets the bar for how to evaluate your performance improvement. However, you also need to identify the issues that contribute to poor performance. To do this you will also need to measure software at different levels of granularity. The tools and techniques available will vary with different systems, but there are two we found particularly helpful.
The first was the Benchmark library built in to Ruby. Benchmark made it simple to trace our policy loading and identify the hot spots.
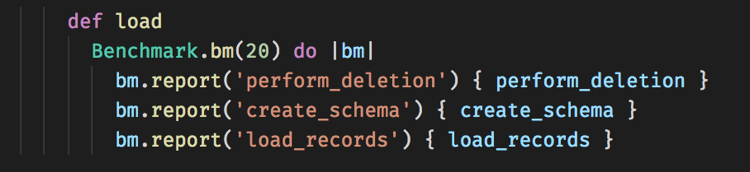
Figure 2) Instrumenting policy loading with Benchmark 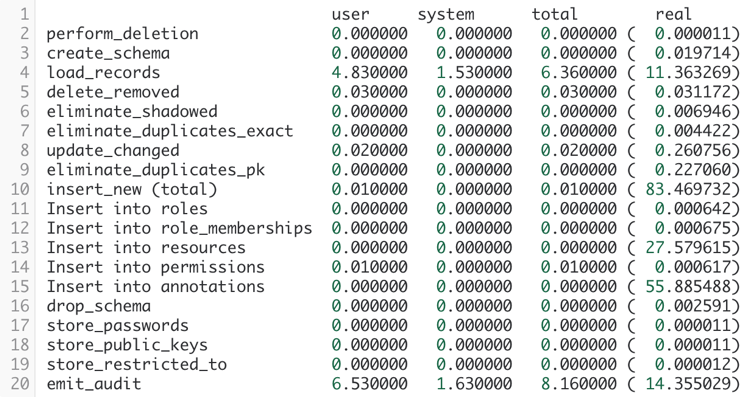
Figure 3) Benchmark results before optimization
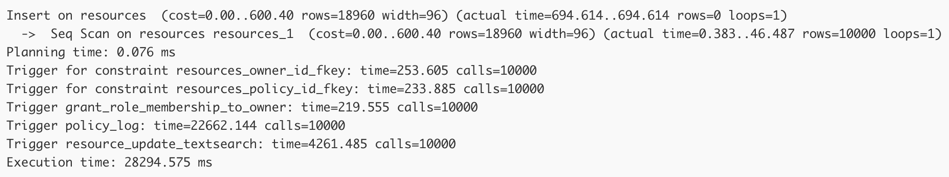
The second tool we found helpful was the built-in `EXPLAIN ANALYZE …` capability in PostgreSQL. This gave us visibility into how the database was handling our data loading. It allowed us to pinpoint trigger execution has a bottleneck in policy loading.

![]()
-
Robust
For your test measurement plan to be most effective, you need it to be robust to both input and environment factors.
To control for input factors, your test suite should measure the inputs’ effect on performance in isolation. In our scenario, we were interested in two inputs. The first was the total number of variables defined in a policy. The second was the number of annotations applied to each variable. Our test suite included cases that allowed us to observe changes in the performance as we altered each input independently.
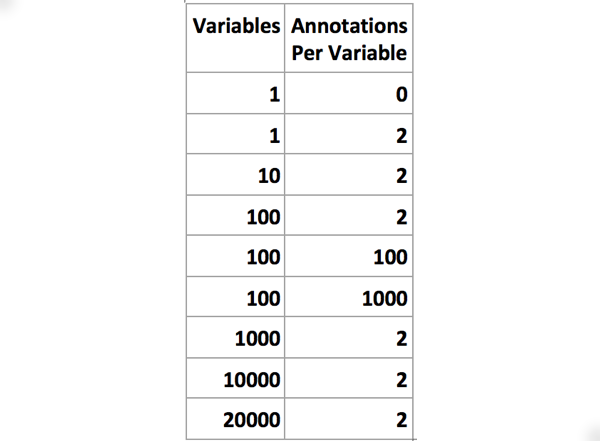
Figure 6) Test case inputs for policy loading
It is also important to minimize the impact of environmental factors on your measurements. This is to ensure your measurements are consistent when given the same inputs. The simplest way to do this is to record several measurements per test case and aggregate the result. We accomplished this by recording an average of two measurements for each test case.
Optimize with Confidence
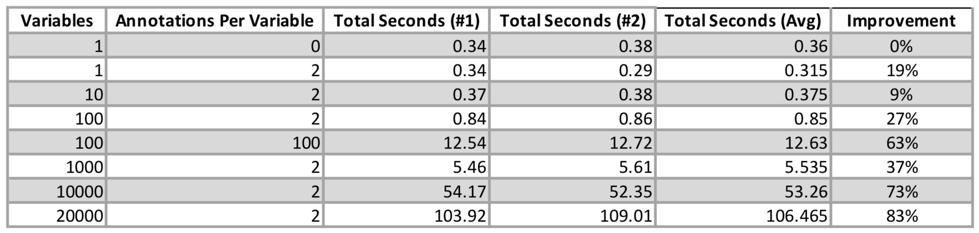
To conclude our project, we identified two optimization changes we wanted to make. The first was to insert all annotations into the database in bulk, rather than as each variable is added. The second was to log policy change records in bulk after loading the entire policy, rather than use database triggers to insert them. These changes allowed us to decrease the response time for our us case by 73% to 54 seconds.
Don’t be satisfied with slow software. These principles helped us work systematically to improve our response time. We achieved our goal while iteratively improving performance. Set clear goals, informed by real use cases, and measure vigorously. Then enjoy the benefits of systematic performance optimization in your development process.
Micah Lee is a Software Engineer at CyberArk, where he strives to figure out the hard parts of DevOps security so you don’t have to. He is passionate about creating tools that augment our natural abilities and fit seamlessly into the fabric of everyday work. Connect on Twitter at @micahlee.